The Potential Sabotage of Your Operations is a 2026 Problem

According to the SANS Institute 2025 State of Operational Technology and Cybersecurity Report, over 22% of organizations (one in five) experienced an OT cybersecurity incident, with many resulting in operational disruption. If this is not enough to keep network and IoT technologists up at night, consider this: remote access was responsible for half of all incidents (only 13%, according to the report, have implemented advanced controls). This sets off a series of uncertainties: Can you field teams access the data they need right now? Will aging equipment fail at the worst possible moment? Could someone on the outside access our data via an Internet of Things (IoT) device? You’re not alone in asking these questions. We are seeing 2026 becoming the year when sabotaging industrial operations moved from theoretical risk to a clear and present danger. According to TXOne Networks’ 2026 Annual OT/ICS Cybersecurity Report, 60% of organizations experienced OT cybersecurity incidents in 2025, with the majority originating from the IT side before cascading into operational technology environments. As nation-state actors, ransomware groups, and hacktivists continue to double down on critical infrastructure, adversaries aren’t as interested in stealing data as they are actively mapping control systems, testing operational disruption capabilities, and preparing for high-impact sabotage. In an era of heightened geopolitical tension and accelerating IT/OT convergence, the ability to remotely manipulate physical processes has never been more accessible to determined attackers, making robust, invisible zero trust protection essential. Operators in oil and gas, agriculture, energy, and utilities are facing: Aging equipment deployed years ago that still need to run reliably in extreme temperatures, dust, and remote locations with zero local IT support Productivity lags when workers and systems can’t get real-time data fast enough across distributed sites Looming cyber threats where hackers could reach your network, even through “secure” connections. Your network’s greatest secret: It doesn’t matter how good your code is if it can’t connect reliably and securely. Traditional approaches create friction. Firewalls you don’t control. IT teams requiring change requests. VPNs and APNs that introduce latency, single points of failure, and incomplete visibility. There is a better way. The FreeWave Zentry™ security solution embeds operational zero trust directly into your connectivity layer. It creates outbound-only encrypted connections that work across any network — no firewall rule changes, no lengthy IT coordination. One integration, and your software connects securely to central systems from day one, whether you have 10 sites or 10,000. Companies using this approach are slashing deployment timelines from weeks to hours and eliminating entire categories of support tickets. If your operations involve distributed assets in challenging environments, don’t lose sleep over connectivity and security issues. Remote access is a 2026 problem that the FreeWave Zentry solution solves as the threat landscape expands.
Why IoT Security is the Biggest Threat to Modern Manufacturing Plants

Walking the floor of a typical manufacturing plant often means encountering workers using thumb drives and manual data collection. While these practices have been the standard for years, they can be slow and error-prone, resulting in higher costs. Facilities have little choice in the matter, as most of these machines were never designed for connectivity. IoT technologies help solve these issues by enabling continuous machine connectivity and automated data collection. However, every newly connected device also expands the cybersecurity attack surface, making secure connectivity essential for modern manufacturing operations. The Hidden Costs of Legacy Data Collection Before discussing what IoT adds to the picture, it is important to consider what manufacturers are working with today. For facilities that have not yet modernized their data infrastructure, common challenges include: Workers physically walk the floor to read machine gauges or check output counts. They use thumb drives to transfer data from isolated equipment to centralized systems, which introduces security risks and potential data integrity issues. Machines run to failure or near-failure because teams cannot analyze predictive signals in real time. IoT deployments aim to address these inefficiencies. The question is how to get there safely. The Growing Role of IoT in Manufacturing Modern manufacturing is undergoing a digital transformation. The concept of the smart factory is becoming a reality for a growing number of industrial facilities worldwide. This shift is primarily due to the Internet of Things (IoT), whose presence in manufacturing has reached a market value of $172.65 billion in 2026. IoT comprises a sprawling network of sensors, monitors and connected machinery that continuously generates and transmits operational data. Implementing IoT in manufacturing relies on sensors installed on equipment to monitor processes and procedures, enabling capabilities that were previously impossible. For example, predictive maintenance algorithms can now detect wear before it causes machine failure, while quality control systems flag defects mid-production rather than at the end of a run. A key part of IoT is the connection between devices, which makes the technology both powerful and vulnerable — while IoT has changed how organizations design and manage industrial operations, it has also expanded the attack surface. The Unseen Vulnerabilities: Exposing IoT Security Risks The same connectivity that makes IoT so valuable in manufacturing is also what creates new pathways for cyber threats. Each sensor or remotely accessible piece of equipment is a potential entry point for malicious actors. Blurring the Lines Between IT and OT Information technology (IT) systems, like servers and workstations, are designed with cybersecurity in mind. They receive regular patches, run modern authentication protocols, use well-established security frameworks and implement network segmentation to prevent potential attackers’ lateral movement. On the other hand, operational technology (OT) systems run physical machinery and prioritize reliability and uptime, but lack security frameworks. Many were designed to operate in isolation and were never intended to connect to external networks. IoT erases that separation. As manufacturers connect legacy systems to corporate IT networks and cloud platforms, they must address the vulnerabilities of internet-connected OT systems without the security architecture to manage them. This combination can result in a hybrid environment that might be more exposed to risk than each system was individually. Top Security Threats for Connected Factories Manufacturing plants face several major IoT-related security threats that can affect both digital systems and physical operations. Weak device security: Many IoT devices use default credentials or outdated firmware. Attackers often target these devices because they can provide relatively simple access into larger industrial networks. Network vulnerabilities: Industrial IoT systems continuously transmit operational data between devices, cloud platforms and control systems. Without proper encryption or segmentation, attackers may intercept or manipulate sensitive data transmissions. Physical disruption through cyberattacks: Cyberattacks against industrial systems can have real-world consequences. Compromised machinery may stop functioning correctly, or manipulated controls may create unsafe conditions for workers. Supply chain exposure: Manufacturing networks frequently connect to third-party vendors and contractors. A security weakness in one of these external systems can create a pathway into the main manufacturing environment. Ransomware and downtime risks: Ransomware can cause real damage to manufacturing operations primarily through downtime that affects revenue and production schedules. Even short disruptions can lead to major financial losses and delayed deliveries. Actionable Steps to Secure and Enable Manufacturing Plants Security and IoT adoption are not opposing. When implemented correctly, security enables sustainable IoT adoption. Reducing IoT risk requires a combination of proactive security strategies. Start With a Full Asset Inventory Teams can only secure devices they are aware of. A complete asset inventory is an essential first step. Manufacturers should identify and document every connected device operating within the system, including sensors, gateways, workstations, legacy equipment and other components with network access. Adopt a Zero-Trust Security Framework A zero-trust framework assumes that no user, device or connection should be automatically trusted. Instead, each access request must be continuously authenticated and verified regardless of its origins. This approach limits the damage attackers can cause if they compromise a single device or account. It also helps organizations enforce stronger identity management and tighter access controls across broad manufacturing systems. Tools like Zentry™ allow teams to integrate zero trust more seamlessly, making the network invisible to threats while providing visibility and control over each component. Implement Network Segmentation Instead of operating on one large interconnected network, manufacturers should divide systems into smaller, isolated segments. If attackers compromise one device, segmentation helps prevent them from moving laterally and accessing higher-value systems or disrupting production operations. Develop a Formal Incident Response Plan Even organizations with strong cybersecurity programs need to prepare for the possibility of a successful attack. A formal incident response plan helps manufacturers respond quickly and consistently during security incidents. It clearly defines stakeholder responsibilities, communication procedures, containment strategies, recovery and escalation protocols. Many organizations are also exploring the use of AI to automate and aid their cybersecurity incident response practices. The Future of Secure Manufacturing Manufacturers positioned for future success recognize that both productivity and security are essential and mutually reinforcing. As manual data
Stranger than Fiction: 3 Essentials of an Industrial Network Security Strategy with Chase Cunningham
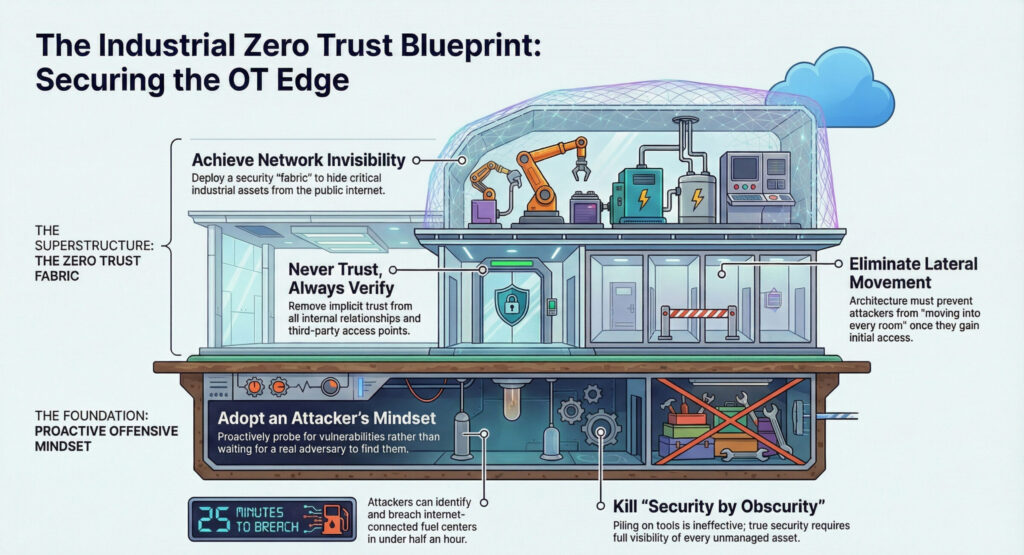
“You must remember … as many times as we win, the bad guys only get better. Our battles are just beginning!” These words conclude a graphic novel by Dr. Chase Cunningham and coauthor Heather Dahl. In “The Cynja: Volume 1,” the protagonist is the evil Botmaster. His thick, purple tentacles; sharp, black claws; and digital-looking scythe try to take down networks in the time it takes to turn the page. The concept is scary real. We sat down with Cunningham for our blog, “Stranger than Fiction: Exploring the New Battlefield at the Industrial Edge with Chase Cunningham (Part 1),” where we explored the rise of cyber threats on the industrial edge and why turning things on, crossing your fingers, and hoping your network stays safe is antiquated and risky. Cunningham, a former U.S. Navy officer who worked in cryptology with National Security Agency and Forrester street cred, now consults with international companies and public organizations. His military experience taught him two things. First, small businesses are targets for nation states because of their connective links to other things (the nature of technology is that attackers get past defenses and sprawl; it’s the difference between a break-in and a break-in-and-move-into-every-room scenario). Second, if you fail to plan, you plan to fail, underscoring Cunningham’s favorite wrong to right. He maintains that operational leaders should remove trust inside the network, first and foremost. Here, we give you three essentials for your network security strategy at the industrial edge, directly from Dr. Zero Trust himself. Essential #1: Offense Wins For OT (operational technology) leaders seeking to protect edge infrastructure, an offensive strategy increases your odds of staying secure. Dramatically. Cunningham’s perspective is clear: the advantage belongs to those who think like attackers. “Are you willing to engage in a red team operation … and let a group of hackers essentially come at you and tell you where you’ve got vulnerabilities?” If the answer is no, then he says there’s an issue right there. For Cunningham, an offense-minded strategy starts with confronting reality and actively probing for security weaknesses the same way an adversary would. That mindset is critical because, in his words, “how can you possibly defend what you don’t know about?” Industrial environments are often sprawling, with unseen or unmanaged assets. Without full visibility, attackers will exploit your most vulnerable gaps first. He frames out the risk in real time. “I could breach these folks in about 25 minutes.” The “folks” Cunningham refers to are fuel centers talking to the internet that he has, with a few clicks, identified. Even more concerning, “a lot of these have crappy usernames and passwords like admin passwords. I could go in there and change fuel controls.” The takeaway isn’t theoretical. Attackers win because they take direct, simple paths into exposed systems. Organizations that take a defensive stance, he says, don’t test potential paths themselves. Instead, they wait for an attacker to do it for them. Cunningham is equally blunt about why traditional approaches fail. “Security by obscurity is not going to keep you safe.” Piling on tools doesn’t solve it either. “If the dart board is continuously moving,” he says, “the odds of me hitting that bullseye is pretty slim.” Reactive defense cannot keep pace with adaptive threats. “Getting breached is not the big problem,” Cunningham adds. “Someone will find a way to get past whatever defense you’re putting in front of them.” If compromise is inevitable, then success depends on how quickly you detect, isolate, and respond. These safeguards come from understanding how attacks actually unfold. In industrial operations, offense wins. Organizations that continuously test, expose, and reduce vulnerabilities don’t wait for a real attacker to do it for them. Essential #2: Zero Trust Protects the Entire Network Dark actors target ICS (industrial control systems) and OT environments. Why? As mentioned in part 1 of this series, industrial infrastructure has evolved rapidly with many more entry points because of today’s ultra-connected world. The cloud, internet and mobile workforce have expanded the attack surface. As a result, attackers don’t look for targets, they look for vulnerabilities. No one is too small or too big. Successful network security strategy means moving beyond legacy perimeter security to dynamic, zero-trust strategies governed by “never trust, always verify.” The goal is to protect the entire network and build resilience against evolving threats so disruptions are eliminated. “A lot of people have been burned without a clear ROI,” Cunningham says. “There’s a unique space around IoT, IT/OT and binary-type applications. OT devices are only supposed to do one or two things and pull up data. The OT space fits well into the strategic side of the equation.” Understanding and knowing what’s going on with your devices is a good start. To Cunningham, security is much bigger than one organization. After leaving the NSA he was assigned a project around zero trust that was already underway at Forrester. He quickly realized that if he was a bad guy, zero trust would have made his life miserable. His thinking around security quickly changed. “I built a framework. I have kids. I really think that in a world where everyone is digital and in a space where we have … access to the internet and all these other things, operating securely is a fundamental human right.” Essential #3: Make Your Network Invisible Through a Zero Trust Mindset Attackers can’t exploit a network they cannot see. Yet, according to Cunningham, there’s a critical step before you get to actual technology tools: embracing a zero-trust mindset so people inside your organization become, well, skeptics. Zero trust is not a single product or model, but a mindset that removes implicit trust from all relationships inside your network. Start with the basics. Define maximum control. What control do you have right now? Where are the gaps? Minimize lateral movement. Do third-parties have access? Does your security allow people to move around easily within your network once they are in? Don’t empower adversaries. Are you thinking offensively? What
The Overlooked Value of Microsegmentation in OT Security
Scott Alldridge, CEO of IP Services, likens microsegmentation to a hotel experience. “You go to the front counter. You present your ID. They authenticate you,” he explains. “They give you a key card. You can go into the exercise center, sometimes a lounge, but you can’t go into other guest bedrooms or the back office. They’re really controlling for a point in time.” Controlling access case by case, he says, restricts “east-to-west” movement within a network. If a breach occurs, the intruder’s ability to move laterally is severely limited. And moving they are. According to The Hacker News, “over 70% of successful breaches involving attackers moving laterally.” This, they say, is causing “organizations to consider rethinking how they secure internal traffic.” Enter microsegmentation and zero trust. Microsegmentation Comes of Age Alongside Zero Trust A regular contributor to Forbes, Alldridge’s passion for technology hails from his high school days where he hid a Commodore 64 underneath his bed in case friends stopped by. At age 19, he started a software company, then reinvented network integration and IT security for MicroAge Inc., a company on the Fortune 500 list the final five years of the last century. Alldridge’s experience comes by way of deep learning through his IT Process Institute, a research organization that studies IT values. One of his chief findings: 70% to 80% of downtime correlates due to unauthorized change, the core battle zero trust is known to win. Microsegmentation, Alldridge points out, is central to zero trust, which takes a “never trust, always verify” approach to eliminating and reducing attacks. Before 2020, he says, perimeter-based security was widely adopted. By 2024, as Alldridge was making his final edits on his 468-page book “The Visible OPS Cybersecurity: Enhancing your Cybersecurity Posture with Practical Guidance” (more than 400,000 copies sold) zero trust was gaining broader adoption. Still, in OT environments, microsegmentation was sorely needed but not exactly wanted. Granular security in an environment requiring 24/7 uptime was perceived as complex and risky. Many industrial devices and systems were not designed with security in mind. Plus, there were legitimate barriers to contend with: the constraints of legacy equipment, patches bridging gaps with modern technology, increased number of devices, and an outdated assumption that operations are off the radar of dark actors. “And so what we’re learning is how to protect those systems,” he says. “Some are SCADA, they’re dated, and a lot of them don’t have the ability to put proper security in place. In a lot of the industrial applications of technology, they’re using third parties to use specific machines, from water pump monitoring devices to CNC machines that cut wood and cabinets to logging and tractors that are in the field. They haven’t thought about the security aspects. Much like we’ve made progress on the electrical grids and the dams and the municipalities to some degree, they’re still working on it, though.” A zero-trust approach, combined with microsegmentation, allows organizations to “apply policies and add procedures … to basically block access, make it impenetrable – unless you allow and open up access to a specific person, individual, a particular network point, or a particular workload or application,” he adds. Used with permission. All Rights Reserved. Microsegmentation Keeps AI in Check While AI has been around since the 1950s, it is now the go-to for many – from the curious retiree to employees using “shadow” AI to write emails and strategic plans to students looking for a good introduction for their research paper. In his Forbes article “How AI Isn’t Just Improving Attacks, But Making Them Continuous.” Alldridge warns of AI’s security risks with the same urgency as Paul Revere’s midnight ride. An excerpt from his article bears why: “By enforcing least privilege communication at the workload, application, and data layer, microsegmentation turns a single compromise into a contained incident instead of an enterprise-wide event. It doesn’t rely on signatures. It doesn’t wait for alerts. It simply makes movement impossible unless explicitly allowed. That’s the key shift: from detection-based defense to architectural containment. When microsegmentation is combined with zero-trust principles, attackers can still get in, but they can’t spread. And in the age of AI, stopping spread matters more than stopping entry.” Alldridge differentiates between generative AI (GenAI) and agentic AI, explaining that while GenAI is popular for creating content, agentic AI refers to intelligent agents capable of autonomous actions within networks. Agentic AI, he says, could identify vulnerabilities, such as open network ports or improperly protected application programming interfaces (APIs), and potentially exploit them. He points out that agentic AI can act quickly, communicating across the network to find and create new breaches or move laterally – that “east-to-west” direction mentioned earlier – within the network. Microsegmentation and zero-trust principles, which both reduce the attack surface and limit the blast radius, counteract AI-driven threats that can create more sophisticated cybersecurity problems. AI agents are “going to be very intelligent,” he explains. “They may see something is open over here and there’s some ports open on the network that should have been shut down on the firewall of the switch or whatever.” If AI sees an application like an API that’s not properly protected, an application interface, or a non-human interface, AI agents could communicate internally, educate themselves, and create a new breach or move quickly east to west along the network. If you think ambitious AI agents sound like science fiction, take a look at this example Alldridge shares. A midsize parts manufacturer recently implemented AI-driven production scheduling and supplier integration tools. In so doing, they exposed several APIs to connect their ERP system to logistics partners and automated warehouse robots. One weekend, an AI agent embedded in a compromised third-party vendor application began scanning internally. Not good. It detected an open management port on a network switch that had been left exposed after a firewall rule change during maintenance. It also found an internal API used for machine telemetry that lacked proper authentication between non-human service accounts. The rogue AI
At the Operational Edge: From Implicit Trust to Zero Trust
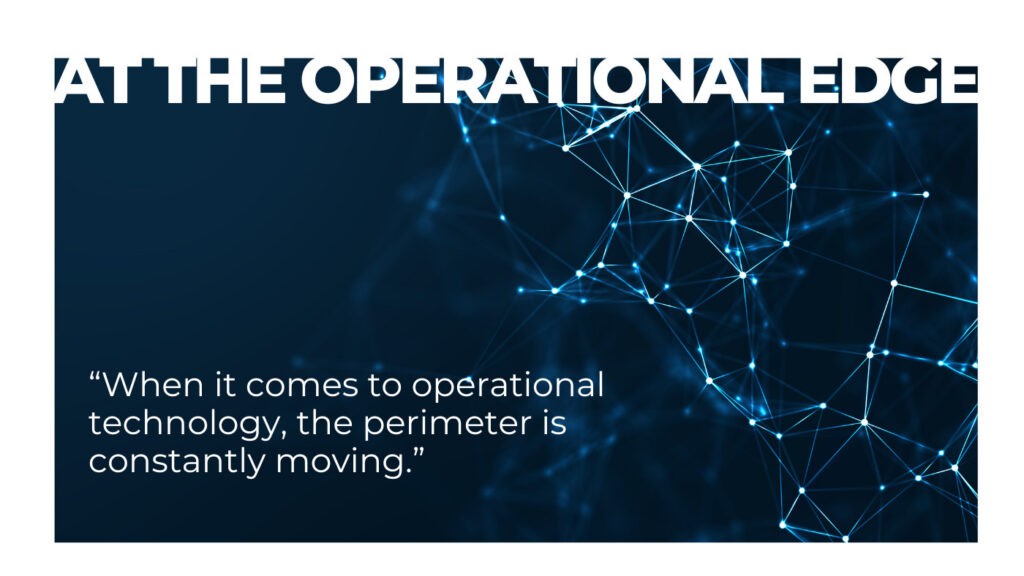
The operational edge is like a mirror. It changes depending upon who’s looking at it. The “edge” for a data center located in an “edge metro” might be vast air-conditioned buildings, with racks of servers lined up in neat and tidy rows, situated along busy highways. For a power company, the edge might be a fenced-in substation located in the middle of a subdivision. Water treatment plants at the edge line rivers and, unlike all of the above, the operational edge for oil and gas producers could be floating vessels in the ocean or span hundreds of remote, desert miles. For industrial operations, the edge may be production facilities miles or oceans apart. We sat down with FreeWave’s CEO and founder Steve Wulchin to explore the operational edge through the lens of someone who has contributed to its evolution. A no-nonsense, culture-driven leader, Wulchin’s worldview was shaped by his diverse, Latin America upbringing. With an eye to the open frontier, he helped introduce long-range connectivity in remote places more than 30 years ago. FreeWave’s 900 MHz radios became an industry favorite standard for SCADA systems and industrial networks with no easy access to Wi-Fi. Over a million devices are in use today. Today, Wulchin and his team are taking a new view of the operational edge. “We define the edge as the very edge of the network,” he explains. “It’s remote and, by definition, you have skinny pipes, typically solar powered, so power consumption is a consideration, and it is exposed to extreme environmental conditions.” The challenge, he says, is that the edge has become more connected, triggering a “recent awareness” about the vulnerability of industrial infrastructure. That’s why he and FreeWave’s team of engineers have spent the last year innovating what they call Operational Zero Trust (OZT). “Operational Zero Trust is about applying zero trust to the industrial world – at the geographic and physical edge. We’ve been active in all these places for over 30 years,” Wulchin says. He understands why the edge has often been an afterthought for industrial organizations. IT and OT have long had different goals. Industrial Control Systems (ICS) focused on production, automation, uptime, and worker safety. It came with implicit trust. In contrast, corporate IT was about protecting the enterprise through segmentation so that a breach could not move laterally across the enterprise. OT systems were not built this way. Today, given IT/OT convergence, Wulchin says that zero trust, with its “never trust, always verify” approach, is critical for protecting industrial infrastructure. For CEOs and boards, Operational Zero Trust is a strategic business advantage that delivers supply chain resilience, network security, and an offensive strategy as opposed to a defensive one. Perimeter Security in OT Environments is Outdated and That’s a Strategic Risk“There’s a growing awareness that when you deploy things like IIoT (industrial internet of things) devices and you don’t secure them and they’re connected to the network, then you’ve just introduced a whole new attack surface,” Wulchin says, adding, “Your network is only as strong as your weakest link. These devices offer a vulnerability all the way to the heart of your network.” Case in point: in FreeWave’s recent conversation with Dr. Chase Cunningham, the author and expert known as Dr. Zero Trust instantly brought up 206 fuel tank control systems talking to the internet in real time. Each was a path to that company’s network. Any one company’s vulnerability can even impact the United States’s national security. According to the Cybersecurity & Infrastructure Security Agency website, there are 16 critical infrastructure sectors whose “assets, systems, and networks, whether physical or virtual are considered so vital to the United States that their incapacitation or distraction would have a debilitating effect on security, national economic security, national public health or safety . . .” OT environments and the larger world are inextricably linked. Technology advancement comes with two trajectories: progress and problems. You may recall the connectivity surge of the 1990s when the World Wide Web became the “World Wide Wait.” More connected devices caused latency issues. Broadband solved the problem of the dial-up era – and those connected devices? They continued to increase exponentially in OT environments as IIoT devices like sensors and gateways, OT and IT systems, PLCs, smart equipment, and the cloud got added to what once were self-contained legacy networks. The traditional security approach required patches: Virtual Private Networks (VPNs) and tunneling to protect the growing attack surface. This perimeter-based security led to exposed visible IP addresses, open ports, tunnels, and gateways that answered back when scanned. In OT environments, access grew faster than security. That led FreeWave to explore the applicability of Operational Zero Trust. At first, the team’s goal was to create ironclad security in a redesigned cellular gateway product called FreeWave Elements ES1000™. The gateway was powered by zero trust. “Out of the development process, we discovered we could secure that device and offer broader applications,” said Wulchin. That “broader application” turned out to be the FreeWave Zentry™ solution introduced in 2025. The zero-trust-based solution protects critical industrial assets by design. The security software acts as a security “fabric” overlaid onto OT systems, without ripping and replacing equipment. It makes the network virtually invisible. As Wulchin says, “When it comes to operational technology, the perimeter is constantly moving.” Since you cannot exploit what you cannot see, the Zentry solution repositions OT security from defensive to offensive strategy. The Danger of Operational ApathyIn conversations with customers, Wulchin says that having a false sense of security is the biggest risk of all. “The world is not getting safer from a cybersecurity standpoint with the advent of AI and where that could take us. To a large degree, FreeWave’s tech is highly disruptive and very different from anything being used to protect OT environments right now. It’s more secure, easier to manage, easier to deploy. It’s just a completely different approach.” Wulchin says the Zentry solution protects the network through a variety of means, protocols, and attributes, while
Stranger than Fiction: Exploring the New Battlefield at the Industrial Edge with Chase Cunningham (Part 1)

“This is the world we all know and love. But there is a darker side to it all . . .” This opening line is from “The Cynja: Volume 1,” a graphic novel about the risks of our digital world. FreeWave sat down with its author, Dr. Chase Cunningham. When not writing fiction, the retired U.S. Navy Chief helps organizations adopt both a zero-trust policy and mindset to author a brighter, safer future. Fortune 500 companies, small businesses, startups, the media, and the U.S. government rely on Cunningham to win the war on cyber. Because while zombies, worms, and botnets may be the work of fiction, the truth, as Mark Twain once said, is far stranger. The Edge is Exposed Cunningham would like to be out of a job. That would mean the world is safe, devices are designed battle-ready, and people are invincible to cyber threats. This is not likely to happen in the near future. “Do you have a statistic to show how at risk we are?” we asked. “I can do you one better, I’ll show you.” That’s when Cunningham tap, tap, tapped on his keyboard, pulling up examples of vulnerabilities in under 30 seconds. It got real, real fast. His black screen lights up with cascading white lines of IP addresses like a scene from an Ironman movie. “These are IT/OT devices. I could breach these folks,” he says casually. “I’m looking at about 206 fuel tank control systems that have gas in the tank.” Travel centers in Dallas, Texas, and New Haven, Connecticut, are on the list. There are gas stations in Georgetown, Virginia. “Those are things that should be fixed and should be isolated. But they’re literally talking to the internet.” Except, they shouldn’t be talking to the internet. Devices and equipment at the edge include wind turbines, water systems, airline systems, and fuel stations. Each, he points out, is a path to corporate, a path to data access, a path to cyber risk. A regional airline booking system is connected to a larger enterprise. Gas stations are connected to global oil and gas companies. The edge is an entry point to a much larger landscape. “Do you really understand how vulnerable we are?” he asks. “. . . an OT/IT, IoT device, people bring them in and plug them in. Who’s holding the bag? If you’re on the internet, it’s an issue for you.” The Case for Zero Trust at the Edge Cunningham has long held a front row seat via senior security and analyst roles at NSA, CIA, FBI, and other government agencies. At Forrester, he pioneered the firm’s Zero Trust eXtended framework. He holds six patents and is the international best-selling author of “Cyber Warfare – Truth, Tactics, and Strategies.” According to a LinkedIn post in early 2025, his podcast The Dr.ZeroTrust Show hit 250,000 listeners on Spotify. At FreeWave, we know zero trust keeps the industrial edge safe. That’s why we’ve introduced Zentry™, a disruptive new technology for industrial operations in the field. Our customers have operated on the edge – from acres of oil fields to water treatment plants to remote agricultural regions – for more than 30 years. During that time, the attack surface has grown alongside the rise of IoT devices. Edge vulnerabilities are sometimes overshadowed by operational stability and legacy equipment not originally designed for modern security concerns. Bringing zero trust to the edge means applying the core zero-trust principle to edge devices and equipment: “never trust, always verify.” While seemingly straightforward, Cunningham says that if you asked 100 people in a room to define zero trust, 99 would take different approaches. Who better, then, to define zero trust than the doctor himself? “In the context of zero trust, there are things in my network or things in my infrastructure that have got default (settings) and are able to do things because they came from the manufacturer that way, especially OT.” He says it’s not a good idea to just turn things on, cross your fingers, and hope that everything goes the way that it’s supposed to. The core of zero trust for operational leaders is to remove trust inside the network. Since OT/IoT devices on the edge are designed for specific functions, they are well-suited for zero-trust security models. “OT, IoT, all these kinds of smart technology things that are coming online now, they’re supposed to be kind of binary in nature, right?” Think of a home thermostat. Its job is to relay temperature much like a sensor monitoring extreme temperature during oil drilling. Neither device should be sending packets of data elsewhere or inviting dark actors in. “If there’s any one area I think you can apply zero trust to, carte blanche, it is OT,” says Cunningham. Zero Trust and Control Zero-trust principles such as segmentation and isolation make it simpler to define what behaviors are expected and quickly spot anomalies. In the OT space, controls limit what these devices can do and who or what they can communicate with, reducing the risk of lateral movement by attackers and limiting the blast radius if a breach does occur. He says that managing OT and IoT environments with policy engines and automation, rather than relying on manual processes, further strengthens security and makes zero trust both practical and valuable. The goal: no dark corners, nothing unexpected, and no empowering the bad guy. Cunningham offers up an example that underscores the complexity and interconnectedness of modern OT/IoT environments and the importance of having policy controls for all connected assets. On one floor of a small factory, machines move things around. Others create products. The machines are on-site with standard infrastructure controls around them. However, another building outside is run by a third-party that produces specific parts for the manufacturing line. Those operational processes must be networked together. The scenario is familiar to anyone in operations.
7 Reasons OEMs Are Adopting Security by Design Early in the Product Development Life Cycle
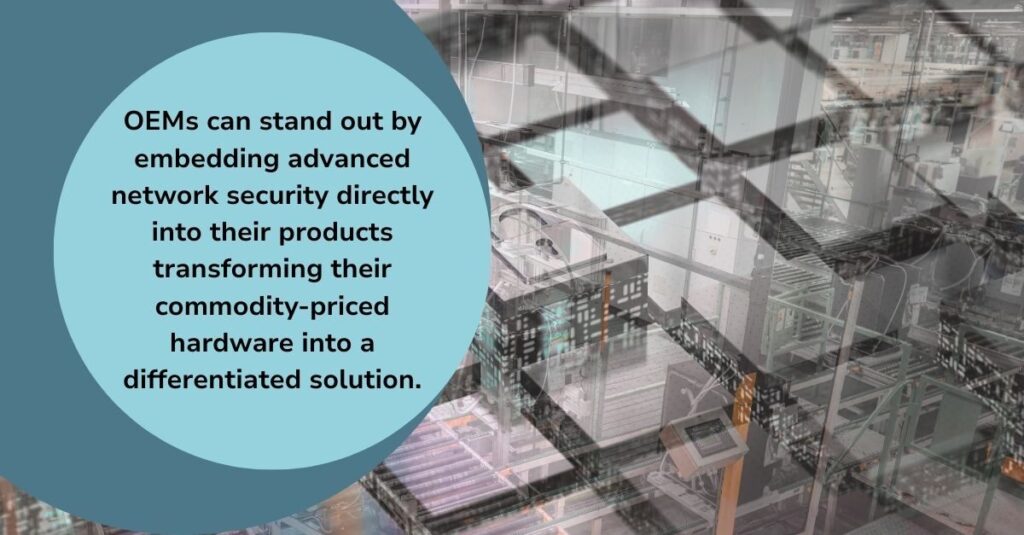
In today’s world, every CEO, CIO, CSO, or CFO is liable for compliance and failing “Pen Testing” (penetration testing) scores, not to mention rising insurance premiums. The pressure of thwarting the increasing security breaches and hacks demand a robust solution that lowers costs and increases network security without navigating complex solutions from multiple vendors. So what is the value proposition of adding security to an OEM’s device early in the product life cycle? “If you were just offering a communications device before, you could be looking at increased network security through the same lens as everyone else,” said Michael Tate, chief operating officer and senior vice president of global sales and marketing for FreeWave. He adds, “The outcomes transform commodity-priced hardware into a differentiated solution.” “Today you are selling hardware and tomorrow you are selling a valuable solution with ARR, all while becoming more relevant to your customer and solving real security problems over just connectivity. If you have devices that give you security and also include communications, you’re going to win faster.” “If you have devices that give you security and also include communications, you’re going to win faster.” – Michael Tate, chief operating officer and senior vice president of global sales and marketing for FreeWave For OEMs, proactive threat detection starts with zero trust. Zero trust ensures every interaction is verified and that OEM products are trustworthy. OEMs and Preparing for the Future The importance of cybersecurity extends to our readiness as a nation. Thousands of OEMs contribute to the U.S. defense industrial supply chain across 16 critical infrastructure sectors. According to the U.S. Department of Defense Cybersecurity Strategy, the first of its kind in the country’s history, ensuring our safety means having “a cybersecurity framework built upon zero trust principles.” As a network is continuously monitored, a zero trust security approach gives systems administrators time to focus on highest-risk items and stay ahead of threats. The Department of Defense has committed to fully deploy zero trust by the end of 2027. The demands for OEMs to address security are rapidly evolving. Secure by Design is a principle that prioritizes security early in design rather than leaving it as an afterthought. Industrial sectors like oil and gas, energy, municipal water, and wastewater departments use thousands of devices across a network. These assets have multiple contracts and multiple vendors. A disgruntled employee or third-party vendor has the potential of seeing everything and doing serious damage with traditional security. Yet, a minute of downtime can cost millions. Take North America’s largest steel producer, $30 billion Nucor, as an example. Its data breach in May 2025 due to “unauthorized third-party access” triggered shutdowns at multiple facilities. As IT/OT integration grows, the Nucor data breach underscores how cyberattacks are growing in sophistication right along with the attack surface, which includes IIoT devices, communications, gateways, sensors, robotics, industrial routers, PLCs, and wireless access points. Security, it turns out, is everyone’s concern, especially forward-thinking OEMs of industrial-grade networking hardware and edge devices like cellular routers, gateways, and modems. Secure by Design products give OEMs differentiation in a crowded marketplace. FreeWave Offers OEMs Competitive Advantage FreeWave has committed more than 30 years to developing industrial wireless solutions. Today, its end-to-end IIoT solutions transform connectivity, security, edge intelligence, and data insights for remote industrial enterprises around the world. OEMs with small, niche markets to mass-produced industrial-grade products successfully embed FreeWave solutions in agricultural products, automation technology and edge devices. The FreeWave Zentry™ solution is a zero-trust based security solution. It cloaks protected networks, making them “invisible” utilizing a simple concept: never trust, always verify. This means the system doesn’t automatically trust anyone or anything trying to connect to it – even if they’re coming from inside the network. Instead, every access request attempting to access resources is verified whether from a user, device, or application, no matter where they are. Here are seven reasons OEMs are addressing security early in the product development life cycle and how the Zentry solution impacts outcomes for both OEMs and their customers. Differentiation in a Commodity MarketThe Zentry solution allows OEMs to stand out by embedding advanced network security directly into their products, moving them beyond commodity hardware and giving them a unique selling proposition. This makes their offerings more relevant and valuable to customers, helping them pull away from competitors who only provide standard connectivity features. Simplified and Consolidated SecurityBy integrating the Zentry solution, OEMs offer consolidated network security as part of their product, eliminating the need for customers to manage separate VPNs, static IPs, port forwarding, and multiple vendors. This reduces complexity, points of failure, and administrative overhead for OEMs and their end customers. Increased Network SecurityThe Zentry solution provides a zero-trust overlay, making devices and networks “invisible” to unauthorized users. It encrypts communications, limits access strictly to what’s needed, and reduces the attack surface – key for critical infrastructure and remote assets. This is especially valuable as cyber threats and ransomware attacks increase across industries. Improved ROI and Lower Total Cost of OwnershipWith the Zentry solution, OEMs and their customers reduce costs by eliminating unnecessary hardware, software, and ongoing maintenance. The solution is aggressively priced, easy to deploy (setup in minutes), and intuitive to manage, making it accessible even for organizations with limited IT resources. Flexibility and Broad CompatibilityThe Zentry solution can be installed on any device with a Linux environment, including cellular gateways, inexpensive Linux boxes, laptops, tablets, and servers, making it broadly compatible with existing OEM hardware and easy to integrate into diverse product lines. Multi-Tenant Management and ScalabilityThe Zentry console is multi-tenant, allowing OEMs to manage security for their own products and for their customers, supporting SaaS and managed service models. This enables new revenue streams and value-added services. Future-Proofing and Market RelevanceAs security becomes a top priority for buyers, OEMs embedding the Zentry solution are better positioned for the future, offering solutions that address both current and emerging threats, and aligning with the industry’s shift toward integrated, secure, and
A Network is an Ecosystem: Rethinking Security for OEMs

In a recent conversation with Anthony Besett of GetWireless, a metaphor emerged: a network is not just a collection of devices, but an ecosystem. The line is as catchy as it is directional: original equipment manufacturers (OEMs), a foundational contributor to global supply chains, have a growing responsibility for securing today’s interconnected environments early in design. How did we get here? Well, we live in a connected world. According to IoT Analytics, which tracks and analyzes IoT connectivity, the number of connected IoT devices will grow 14% by end of 2025, reaching 39 billion in 2030 and more than 50 billion by 2035. That’s six devices for every single person on earth. Another way to frame this: 73.2% of the world’s population accesses the internet. A parade of innovative technologies have arrived: artificial intelligence (AI) infrastructure, hyperscalers (developers scaling data center networks), quantum computing, and the data center surge. Deloitte ranks “cyber and/or physical security concerns” as number three on its list of data center infrastructure challenges, tapping OEMs on the shoulder to take note of technology’s evolving impact. Besett serves as Vice President OEM Embedded Solutions for GetWireless, a leading value-added distributor of cellular solutions like intelligent gateways, servers, asset trackers, modems, and other solutions for IoT applications. Besett predicts that OEMs focusing only on designing, making, and selling products may be shortsighted. IoT devices are increasing and networks are becoming more complex. The stakes for robust, holistic security have never been higher – and OEMs recognizing that their products are responsible for the entire network ecosystem will be the ones to differentiate their product. Intentional security for OEMs is a bold leap forward for customers. Beyond Silos: A Network as a Secure Ecosystem Besett emphasized that traditional approaches to security often focus on isolated components, protecting a gateway here or running penetration testing (pen testing) there. He says, “We have to be paying attention to security across the entire infrastructure, not just one piece of it. Historically, you’ve seen there’s attention to one piece.” Many of GetWireless’s suppliers do pen testing, for example, but Besett sees that changing in the future with security-minded solutions that are guaranteed to protect networks and all the devices that go beyond that point. Here’s why: in an ecosystem, every element is interdependent. A vulnerability in one device – like a sensor, workstation, or camera – threatens the health of the entire network. Just as the rapid spread of Dutch Elm Disease endangers a forest, a single weak link in a network can compromise an entire digital environment. As an example, consider the Mars Hydro breach. The China-based maker of LED grow lights had 2.7 billion records exposed, including passwords, IP addresses, and device IDs, all because the attacker was in Wi-Fi range. OEM manufacturers have an opportunity to help mitigate the risks of IoT data breaches. Besett shares, “I was in a conversation not too long ago where a customer’s whole network was hacked because somebody plugged into a gateway that wasn’t controlled. And so now you’ve got a hole. There are lawsuits. It’s going to be a mess.” He says fragmented security leaves the entire network ecosystem exposed. The takeaway for cybersecurity: silo thinking is risky when it comes to individual OEM network products. A piecemeal approach is no longer sufficient. Zero Trust Security and Zentry Besett points out the value of zero-trust architectures, such as the FreeWave Zentry™ solution. Referencing back to his customer example, he explains, “There were vulnerabilities there that if something like Zentry was on that, that wouldn’t have happened because they (the attacker) would have actually had to request access.” “The devices on the edge, sensors, the workstations, the PCs, the tabs, the LPRs, all those different things, they get security as well. And it’s really cool because Zentry controls who has access, when they have access, and exactly what they have access to. What’s so unique about Zentry and their kind of ‘look’ on the infrastructure is . . . giving the control to an OEM to be able to secure everything for their customers, not just one piece.” Security must extend to every part of the network ecosystem, he says. It’s not enough to lock the front door; every window, back door, and fence line needs protection. The FreeWave Zentry solution secures not just one component but the entire deployment by making the attack surface invisible – there are no public IP addresses, open ports, or static tunnels to scan or exploit. Ephemeral sessions mean access appears only when needed and disappears when complete, leaving no standing exposure. Deterministic control removes noise, helping small security teams focus on real threats without wasting time on no false positives. Besett explains, “Zentry controls who has access, when they have access, and exactly what they have access to.” This Identity-driven access ties every connection to a verified user, device, and policy for precise control. Devices, from license plate readers to medical wearables, become ubiquitous and integral to securing critical operations. At GetWireless, Besett says the company looks at the entire connected world, including body wearing devices, POS machines, monitoring cameras, and weather stations. “We’re engaged at all those different levels in the community,” he says. Security, according to Besett, is no longer a “nice-to-have” but a fundamental requirement for any device that connects to a network. He notes, “Do you want to be the hole in the network that creates the problem for a customer or brings down a network?” The risks are real, from lawsuits to national infrastructure threats. Zero trust gives OEMs an opportunity to proactively address vulnerabilities at every layer, not just at the gateway or a single device, but across the entire ecosystem. What OEMs Need to Know About Zero Trust Security is poised to become a differentiator in the marketplace. With many devices becoming commoditized, Besett suggests that embedding zero trust could set OEM network products apart. Besett asks a good question: “Why would you choose a device that doesn’t meet
Ditch the Wires, Keep the Power: FreeWave ZU1100 – The Smart Wireline Replacement Solution
IIoT often lives in harsh environments where trenching equipment, excavators, and backhoes can be challenging and expensive to operate. Costs escalate based on trench length and depth, soil type, post-trenching land restoration, permitting costs, and regulatory requirements. Then there are maintenance considerations once copper wire is in the ground. If wire breaks underground, how do you know where the problem is? In places like the American West or Canada, where wild fires exist, wires require flame-retardant, or self-extinguishing jackets. High-temperature environments, chemical exposure or flood zones also require extra maintenance for underground wire. Rising copper prices pose a rising theft risk too – a billion dollar industry annually according to Nasdaq – where criminals trade stolen copper for profit, putting critical infrastructure at risk. “Aging, trenched wired infrastructure is a high risk. You need to get in front of the problem because it’s not a matter of ‘if,’ it’s a matter of ‘when’ that wired infrastructure will fail,” said William H. Conley, III, director of technical and customer support at FreeWave. That risk is highest for legacy industries like oil and gas, utilities, and water wastewater treatment. As digitalization increases, reliably transmitting analog and digital input/output (I/O) and sensor data across long distances becomes even more critical. Traditionally, as an example, transmitting 4-20mA signals over long distances has required trenching miles of shielded twisted pair (STP) wire. In the past, trenching of wire signals has been a costly and maintenance-heavy process. Enter ZumEdge® ZU1100. FreeWave’s latest wire replacement solution is designed to make buried wire a thing of the past and industrial analog and digital I/O and sensor data flow. What Is ZU1100? Wire replacement solutions aren’t new. Many companies offer solutions that are deployed in a lot of networks, today. However, the ZU1100 IS different. It is a bi-directional I/O wireless solution that replaces labor-intensive wired connectivity for customers in industrial sectors. The best part is a hallmark of FreeWave’s design philosophy: install it and it just works. It’s pre-configured so you literally plug it in and it works. ZU1100 mirrors analog and digital signals from one point to another, eliminating the need for physical wiring. Whether you’re monitoring a remote water tank’s level or controlling a pump miles away, ZU1100 transmits real-time analog and digital I/O and sensor data, to include 4-20mA signals current loops over distances of up to 20 miles, or farther in some instances. The DIN-mountable device is sleek, measuring about the size of your favorite summer read. It supports two analog inputs/outputs and two digital inputs/outputs on each end, enabling two-way communication between field equipment and control systems. Being able to quickly analyze and respond to data variations is one of the paramount benefits from FreeWave solutions. What’s better is that FreeWave is no stranger to radio technology. We’re trusted. Since 1993, FreeWave has led the way with more than 800,000 units in use around the world sending telemetry data to users. As data has evolved, thousands of customer conversations led to innovating the an evolved solution that truly scales. Unlike previous one-way solutions, the ZU1100’s bi-directional design allows for peer-to-peer and, soon, peer-to-multi-peer relationships (with its ability to support up to 32 remote devices in future updates). Future features include support for additional protocols and system integration for streamlined workflows. “How industry collects information is identical across markets such as oil and gas, utilities, water/wastewater, and building automation,” said Conley. Add to the list industries like agriculture, smart cities, chemical processing, and manufacturing. When industry requires analog I/O signals, they prefer 4-20mA current loops. Why? Because the signal is almost immune to electrical noise and interference, delivering reliable signals. “It’s the same analog and digital I/O signals, the same protocols like Modbus and MQTT (that many industries use). What might differ is the regulatory requirements and the type of command and control,” said Conley. Even there, ZU1100 is prepared – for anything. Conley said that FreeWave designs solutions to the “absolute most challenging scenario.” ZU1100 is industrial grade: Class I, Division 2-certified (C1D2). It can operate in temperatures from -40°C to +75°C and is explosive proof – a must-have for oil and gas customers. Along with ease of use, security is another signature design element in FreeWave solutions. AES encryption is available on ZU1100, with future plans for enhanced network security via FreeWave Zentry™, a secure connectivity solution introduced by FreeWave earlier this year based on zero-trust principles. Future integration of AI and advanced protocols are also on ZU1100’s ideation board. ZU1100 Use Cases Field technicians, administrators, integrators, and partners in industrial sectors wrestling with wired sensor systems have a number of use cases that highlight ZU1100’s plug-and-play installation, bi-directional I/O, and rugged, reliable performance. Here are three high-impact use cases: Industrial Monitoring A remote water tank with sensors measures level, pressure, and pump current, all while feeding into a programmable logic controller (PLC). ZU1100 transmits signals wirelessly for remote monitoring and control. Automated Control Devices are connected in real-time so operators send commands such as turning on a pump or shutting down a system based on sensor readings – without the need to trench and maintain long runs of physical wiring. This use case is ideal for industries where assets are distributed over large, hard-to-wire areas. ZU1100’s bi-directional monitoring and remote actuation increases operational efficiency and reliability. Protocol Bridging and Legacy System Modernization ZU1100 helps organizations transition from legacy systems using protocols like Modbus to modern IoT protocols such as MQTT. (According to a 2022 survey by HiveMQ, 50% of respondents use MQTT as a standard protocol.) ZU1100 can bridge analog/digital, I/O and serial/Ethernet protocols so data flows between old and new equipment, allowing gradual modernization, and supporting both legacy and next-generation protocols. What’s Next? At FreeWave, our vision is to make receiving and sending data easy. It’s a world where we see IIoT being scalable, smart, and simple. ZU1100 is a next-generation, customer-driven solution that bridges the gap between legacy systems and future-ready industrial automation. The solution creates connected, intelligent, and
Are Static IPs a Liability in the Industrial Space? Or Are You As Protected as You Think?

Actor John Krasinski plays Jim Halpert in The Office. Jim’s one-liners pave his pursuit of a fulfilling sales career at Dunder Mifflin, a paper company. (Example: I am about to do something very bold in this job that I’ve never done before: try.) Spoiler alert: Krasinski becomes one of the company’s top salespeople. That’s what human beings do. We evolve. So does technology. Today, industrial internet of things (IIoT) data demands devices that are dynamic because, like Krasinski’s character, networks are continuously evolving. The goal? Make your network and devices resilient. In this blog, we’ll explore the number one problem for cellular network industrial users, what you should know about static and dynamic IP (Internet Protocol) addresses, how they impact network security, and a true story of how we hacked into a customer’s network – during a meeting with them. ——————————————————————————–—- What are Static and Dynamic IP Addresses? Why Should You Care? Let’s start with the basics. An IP address is a string of numbers identifying each device connected to a network. The Internet Service Provider (ISP) assigns the unique device “name” allowing it to: Be recognized by the network (hey, I see you) Communicate with other devices (let’s talk) Historically, industrial devices use static IP addresses. From web servers to sensors to VPNs, these addresses are fixed. They never change. It’s kind of like living at the same house address all your life – when people know where you live, they can send you whatever mail they want, whenever they want. In contrast, dynamic IP addresses get assigned a unique address by the Dynamic Host Configuration Protocol (DHCP) server. Every time a router reboots or the system changes or said device is not in use, the device’s IP address changes. In this case, imagine living in Paris one day and Milan the next. With no one knowing your address, you are free from receiving junk mail forever. In the Age of Connectivity – where devices, data, and business scenarios are constantly in flux – are static IPs a liability for industrial users? Why do Industrial Companies Use Static IP Addresses? In short: dependable network access. Businesses need consistent destinations for sending data and a stable address to connect to. Dynamic IP addresses, which shift over time, complicate this process. For a clearer picture, think of how tricky your search for information would be if Google’s website address kept changing. While consistency has been the reasoning behind static IP addresses, technology has evolved – and so has cyberattacks. The vulnerability of static IP addresses now outpaces their original usefulness. Unidirectional vs. Bidirectional Integration Most cellular devices are designed with unidirectional integration where information travels one way. For industrial users, this means data from the edge travels to the world. Many cellular devices are not factory-equipped with a bidirectional, or two-way, data path. A garage door sensor with unidirectional data, for instance, only gets you so far. If you put your bike away, but forgot to close the garage door, an alert notifies you. It’s now Sunday morning so you’re home and can close it as you get your morning coffee going. It doesn’t work, though, if you’re on a flight to Turks and Caicos (although an open garage door probably wouldn’t ruin your vaca). A better way would be an app where you click a button and close the door, and it’s confirmed on your phone. This way, you have a secure home no matter where you are. The same scenario holds true for industrial use cases. Bidirectional data allows you to turn devices – like pumps, drives and machinery – on and off to prevent failures and save time driving to remote places. What is the cost of an oil spill for an hour or productivity loss because machinery is down or, most importantly, equipment failure that triggers unsafe conditions? Devices with bidirectional integration lead to greater data accuracy and data accessibility across the enterprise. In a connected world, data democratization gives people insight to make smarter decisions and be more productive. For example, when a project manager and a safety engineer access the same real-time data, rather than work in data silos, system integration creates more efficient workflows. Shared data, connected “things,” and different platforms work together. Cellular devices with a bidirectional data path help integrate a project management platform with safety data. Imagine watching an HMI (human-machine interface) screen to monitor a pump’s pressure, temperature, flow rate and vibration. The screen flashes red, indicating high pressure and overheating. You’re able to hit the off button, eliminating a potential explosion. Every second counted and with bidirectional data, you averted disaster. Think of it this way: unidirectional data brings “problems” to you with no simple button to fix them. Stressful. Bidirectional data brings “problems” to you and the ability to solve those problems. Peaceful. One solution, however, begets more issues. At each end of the connection, there is an IP address or, put another way, a fresh opportunity to hack your network. Top Concern: Security Breaches Have you ever had a conversation involving IoT where security wasn’t part of the discussion? The answer, most likely, is no. With the continued rise of IoT devices on the network, the news platform Sci-Tech Today estimates that around 33% of attacks on IoT devices may impact critical operations, followed by 32% lack of skilled personnel to implement IoT security. Dynamic IPs can create greater network resilience because they simplify network administration and they typically experience fewer errors. Two words: be prepared. In our view, security is the biggest concern associated with IP addresses. Static IP addresses are easily trackable (after all, they always stay the same). Hackers can more easily compromise them and move horizontally across the network to target other digital assets. This is one reason why security is more than an IT problem, it’s a leadership concern. Find out why network security matters to C-suite executives. Read the blog. After more than 30 years working with remote industries, we believe in security-first design